Nvidia GPU는 최근 크게 여섯가지 아키텍처로 구별할 수 있다. <그림 1> 참고.
Compute capability가 높을수록 최신 아키텍처라고 생각하면 될 것 같다.

<그림 1>
GPU로 CUDA programming을 하면서 GPU Kernel을 분석할 필요가 있다.
Nvidia에서는 profiling tool로 크게 두 개를 제공한다.
Nvidia nvprof
- CLI 기반으로 profiling data를 보여준다.
- Kepler, Maxwell
Nvidia Nsight compute
- Grahpic 기반으로 profiling data를 보여준다.
- Pascal, Turing, Volta
Pascal 이후 Nvidia 아키텍처에서는 일반적으로 nvprof를 사용할 수 없고 Nsight 사용을 권장한다.
( 여기 저기서 CUDA toolkit을 다운받아 설치하면 부분저적으로 사용할 수 있기는 하다...)
Nsight를 우분투에 설치하고 사용하기 위해서 [2]에서 Nsight를 다운받고 설치한다.
이후 Nsight를 실행하고 profiling을 할 때 다음과 같은 에러 메세지를 만날 수 있다.
"ERR_NVGPUCTRPERM: Permission issue with Performance Counters
총 3단계로 위와 같은 에러 메세지를 처리할 수 있다.
1. Nvidia에서 기본적으로 제공하는 모듈 언로드
$ sudo systemctl isolate multi-user // Stop the window manager (run level 변경)
$ modprobe -r nvidia_uvm nvidia_drm nvidia_modeset nvidia-vgpu-vfio nvidia # Unload dependent modules
2. Access 권한 설정
- administrative privileges
$ modprobe nvidia NVreg_RestrictProfilingToAdminUsers=1
- any user
$ modprobe nvidia NVreg_RestrictProfilingToAdminUsers=0
3. Reboot
systemctl isolate graphical // Restart the window manager. (run level 변경)
* 현재 시스템의 run level은 아래와 같은 명령어로 확인할 수 있다.
$ sudo systemctl get-default
에러 처리 이후 Nsight System을 실행한다. <그림 2> 참고.
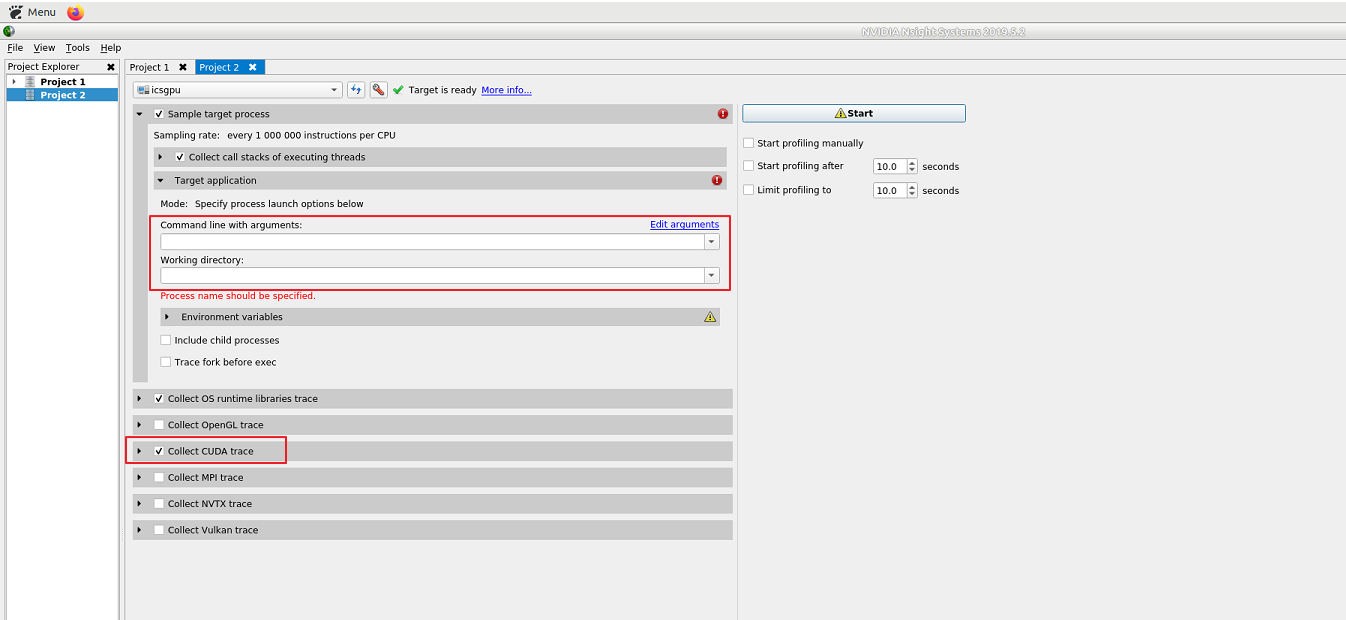
<그림 2>
<그림2>에서 가장 잘 설정해주어야할 부분은 다음과 같다.
Target application -> Command line with arguments, Working directory이다.
Nsight System 내부적으로 Working directory의 Command line with arguments 을 실행한다.
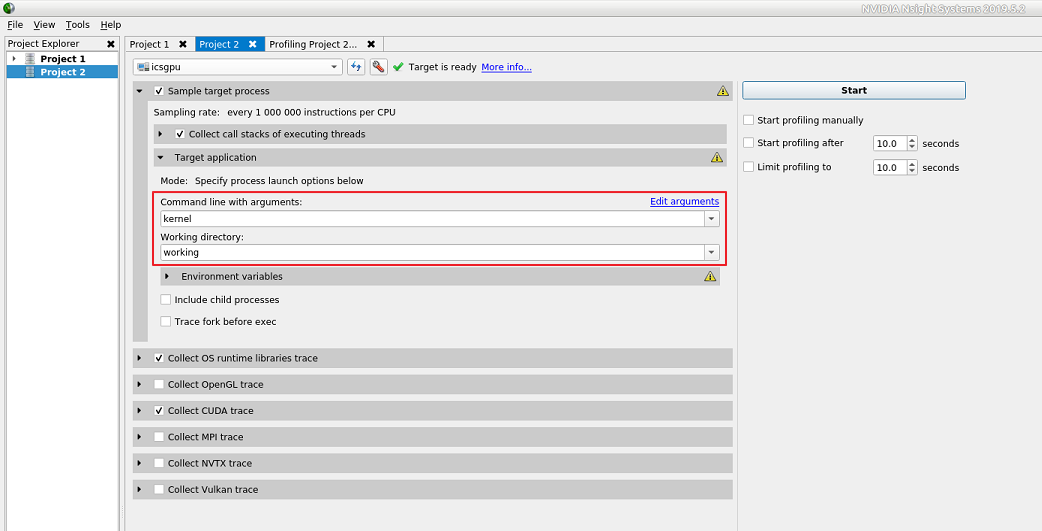
<그림 3>
<그림 3> 처럼 실행 방식을 알아보기 위해 간단히 input parameter를 설정해주고 우측 상단의 Start를 클릭한다.

<그림 4>
<그림 4>의 에러를 확인하면 working directory | Command line with arguments (concatenate)되어 실행된다.
루트 경로부터 working directory를 설정해야한다는 것을 주의하자. (pwd 명령어로 디렉터리를 확인하는게 정확하다.)

<그림 5>
Nsight System profiling tool이 자동으로 멈추지 않기 때문에 적당한 시간을 기다린 후 stop을 누르면 된다.

<그림 6>
Stop을 누르면 <그림 6>처럼 profling data가 graphic으로 잘 나타나는 것을 확인할 수 있다.
==================================================================
추가적으로 /proc/sys/kernel/perf_event_paranoid의 level에 따라 profile 할 수 있는 값이 다르다.
Nsight는 다음과 같이 설명하고 있다.
Collection of IP samples, backtraces, and scheduling data disabled. perf event paranoid level is 3.
Change the paranoid level to 2 to enable IP sample, backtrace, and scheduling data collection. Change the paranoid level to 1 to enable kernel sample collection.
Try $ sudo sh -c 'echo [level] >/proc/sys/kernel/perf_event_paranoid' where 'level' equals 1 or 2 to change the paranoid level.
필요에 맞게 level을 잘 설정하여 사용하기를 바란다.
==================================================================
[reference]
NVIDIA Development Tools Solutions - ERR_NVGPUCTRPERM: Permission issue with Performance Counters
Overview This page provides an explanation and solutions for the following error message from various NVIDIA development tools: ERR_NVGPUCTRPERM The user running tool_name/application_name does not have permission to access NVIDIA GPU Performance Counters
developer.nvidia.com
[2]https://developer.nvidia.com/nsight-compute
NVIDIA Nsight Compute
NVIDIA® Nsight™ Compute is an interactive kernel profiler for CUDA applications. It provides detailed performance metrics and API debugging via a user interface and command line tool. In addition, its baseline feature allows users to compare results wit
developer.nvidia.com
'ETC...' 카테고리의 다른 글
| [Ubuntu 18.04/20.04] Virtual Machine with Passthrough (0) | 2020.10.27 |
|---|---|
| [Ubuntu 18.04/20.04] How to install intel-OpenCL on Ubuntu 18.04 (0) | 2020.10.27 |
| [Ubuntu 18.04] How to install xrdp, xmate on Ubuntu 18.04 LTS with Nvidia graphic card (1) | 2020.02.21 |
| Ubuntu 18.04, Install Nvidia driver and CUDA, cuDNN (0) | 2020.02.11 |
| [Ubuntu] How to Kernel Compile (1) | 2019.10.20 |
